1. Introduction Last updated: 2023-10-27
This document includes a guide on how to use the "Inspectimark" map. Below, you'll find an image displaying our Web GIS panel's homepage, with various sections highlighted for in-depth discussion to follow.

1.1. Map Service
This section offers both spatial and nonspatial data concerning the map of markings. It showcases tools associated with the map and the information accessible through it. To enrich user engagement with the map service and simplify data and information exploration, we've seamlessly integrated an array of tools and functionalities into the map interface. Detailed information on these map features and instructions on their utilization can be found within this section.

Note
To make full use of the tools in the map service, it is necessary to have created an account. After your user account has been approved by the system administrator, you can log into the system.You can see how to signup and create an account in section 2.1.User Profile of this guide.
1.2. Statistics
In this section, general information regarding projects have been uploaded. Based on the your access level, you can view these information. Further details are provided in Section 3.Statistics

1.3. Report
You can view reports related to various projects frmo 1.3. Report. Depending on the your access level, different reports will be displayed to you. Further details about this section can be found inbelow.

1.4. F&Q
This section addresses frequently asked questions, including marker types and various definitions.
2-Map Service
To enhance user interaction with the map service and facilitate the exploration of data and information, we have integrated a diverse set of tools and features within the map interface. Comprehensive information about these map features and instructions on how to use them can be located in this section
2.1. User Profile
Realizing the complete potential of map features and gaining access to both spatial and non-spatial information requires the imperative step of completing the system registration process. Once your user account receives approval and access levels are set by the system administrator, you will have the ability to access map data and employ crucial data analysis tools in accordance with your access permissions. To initiate the user account creation process, please adhere to the steps below.
To create a user account:


Note
Once you've successfully created your user account, the system administrator will conduct a review of your account information. Following approval, you will receive a confirmation email containing your user account details. Subsequently, you can log into the system by using the username and password provided to you.

You are now able to utilize map tools and features in accordance with your access level to the information.
2.2. Map
In the map interface, you'll find an array of tools and features aimed at enhancing the user's ability to navigate and explore the map space with greater ease and efficiency. These tools are designed to simplify interactions with the map and enhance the overall user experience.
 Control 1: Latitude & Longitude
 Control 2: Zoom Level
 Control 3: Scale
Controls Table:
| Control 1: Latitude & Longitude | As you move the mouse cursor across the map, it shows the geographic longitude and latitude in the WGS84 coordinate system. |
|---|---|
| Control 2: Zoom Level | Control number 2 represents the zoom level. You can adjust the zoom level through drag-and-drop interactions, and it's also possible to change the map's zoom level using the mouse scroll wheel. |
| Control 3: Scale | This control also displays the map's drawing scale, providing assistance in grasping real-world dimensions |
Attention:
2.3. Basemap
This map service utilizes three base maps.
 Open streem map(OSM)-dark
 Open streem map(OSM)-light
 Satelite Imagery
Attention:


2.4. Mesurement
Within the map service, you will find a built-in measuring tool designed for accurately determining both length and area. This tool provides measurements in SI units, ensuring precise calculations for your needs


Upon enabling the length or area option, as you move the mouse pointer across the map and click on your chosen points, you will receive real-time distance and area measurements. If the measurements are below 1 kilometer, they will be presented in meters, while measurements exceeding 1 kilometer will be displayed in kilometers.


Attention:
2.5. Evidence Panel
The images and videos corresponding to each defective section are viewable here. When you choose a specific section on the map, this panel opens automatically, displaying images or videos that illustrate the presence of defective markings in that section. It's important to note that this evidence is exclusively provided for sections with a health score below 10. If a section has a health score of 10, the evidence panel remains empty, showing no content.

Attention:

2.6. Information panel
This panel provides comprehensive details about the chosen section, encompassing a range of information, including, but not restricted to:
In this map service, when the identify tool is enabled, you can click on any feature to access its descriptive information. It's important to note that your ability to view this information depends on the access level that has been defined for descriptive data.

1.Road Information:
This section includes data such as the highway name, segment name, and section number.

2.Health Score and Visibility:
Here, you can find the overall health score and visibility of the chosen section, derived from the collective results of all the measurements.

3.Measurements Information:
This part furnishes data on the measurements conducted, including the number of measurements taken, the time of day for each measurement, the prevailing weather conditions during each measurement, and the health score associated with each measurement.

4.Markings Information:
It specifies the count of various types of markings present in the selected section.

2.7. Search
This tool allows you to look up a particular highway or segment.

Attention:
2.8. Layer
In the 'Layer' section, you have the option to on or off information layers. Enabling a layer will display its associated data on the map for your convenience. Using the tool below, you can reach the 'Layer' section.

Attention:
.jpg "Layer")
2.9. Style
You can customize the color ramp of the line layer based on either the score or visibility.

2.10. Filter
With the filter tool, you have the capability to refine the results according to various criteria, including health score and visibility.

3-Statistics
Within this section, you'll discover data pertaining to the project's advancement, the percentage of completion for each highway, the quantities of collected, analyzed, and deployed data, and a comparison of different highways based on the quantity of defective markings.

3.1. Project Perspective

3.2. Quantity of markings

3.3. Percentage of Faulty Markings

3.4. Comparing Highways

4-Report
You have the capability to create personalized reports for the entire project or for a specific portion of the project, be it a particular highway, segment, or section. The types of reports you can generate, including defect reports, visibility reports, risk reports, prediction reports, maintenance reports, and performance reports, are contingent upon your access level.

Currently, defect and visibility reports for segments are visible and available for download.
 1. Segment selection
 2. Choose this option to visualize the segment on the map.
 3. Displaying the segment on the map.
 4. Clicking on the "Reset" button in the filter section to show all segments.
5-FAQ
5.1. What categories of road markings are identified by InspectiMark?
Our AI model can distinguish between 16 types of markings, each classified into two categories: 'Correct' and 'Defective,' resulting in a total of 32 distinct categories. These 16 types of markings are shown below. Correct markings are specified with a “c” letter after the name of the marking, e.g., a correct rectangle is shown by “rcc” or a correct yield is denoted by “yc”. On the contrary, defective markings are specified with a “f” letter after the name of the marking, e.g., a defective rectangle is shown by “rcf” or a defective yield is denoted by “yf”.
")
")
")
")
")
")
")
")
")
")
")
")
")
")
")
")
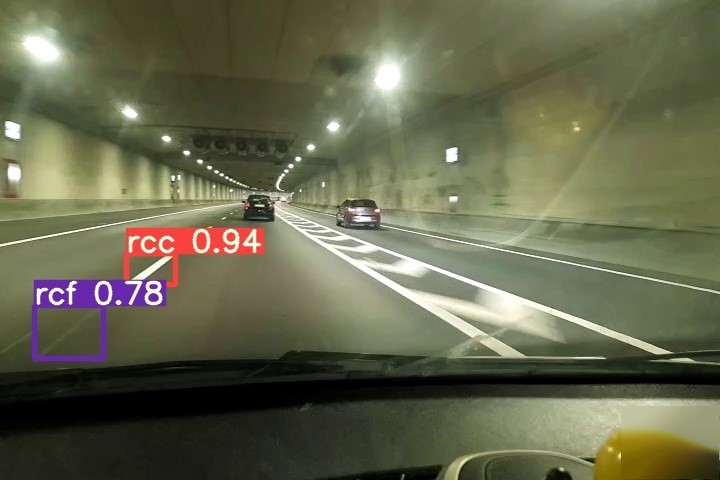
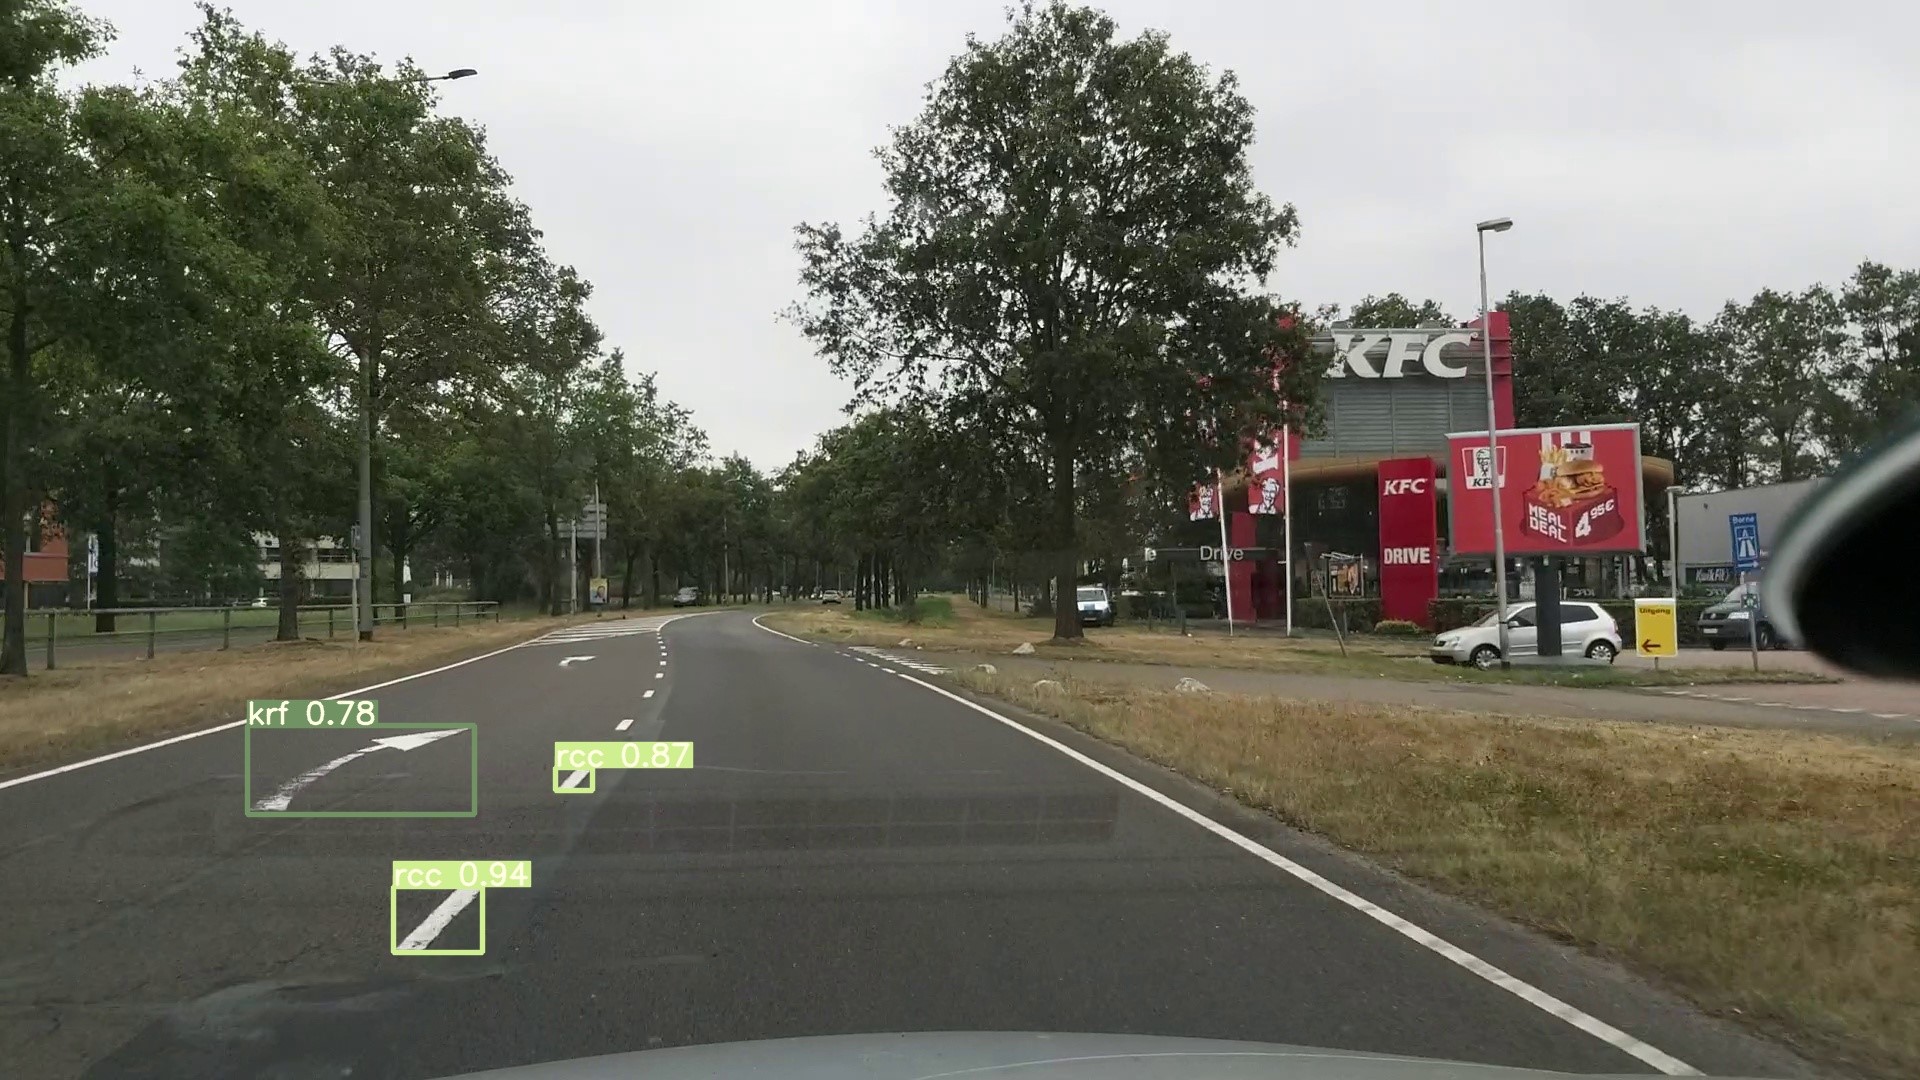
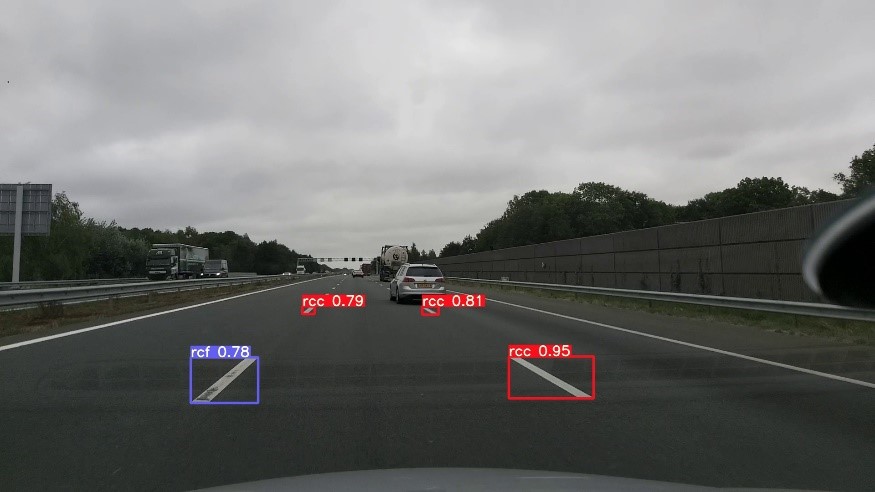
5.2. When is a marking identified as a defective marking?
Our AI technology has undergone extensive training using a substantial dataset comprising thousands of labeled road images. These images were captured from various locations on Dutch roads and meticulously labeled by our team. This dataset encompasses both correct and defective markings. Accordingly, when the AI model analyses videos provided by the users, if a marking is faded or partially-removed, the AI model labels it as a defective marking. Some examples of defective and correct markings are illustrated below.
5.3. How have the roads of RWS been divided into discrete segments within our Web GIS panel?
RWS has designated distinct names for their highways, such as A29, A10, and so on. Each of these highways is subsequently divided into shorter segments, ranging from less than 1 kilometer to more than 104 kilometers, as determined by RWS. These segments are further subdivided into sections, each with a length of 40 meters, and detailed information regarding the markings within each specific 40-meter section is provided. In essence, each section contains comprehensive information about all the markings present within that particular 40-meter segment. It's important to note that the section lengths have been carefully chosen to strike a balance between providing a satisfactory level of detail and ensuring practical ease of maintenance. If RWS has any particular preferences or requirements regarding section length, we are open to making adjustments accordingly.
5.4. What is visibility?
In the context of road markings, visibility refers to how well these markings can be seen and recognized by drivers and other road users. It encompasses various factors that affect the ease with which road markings can be observed, understood, and followed, ensuring safe and efficient traffic flow. Some key factors influencing visibility in road markings include:
Contrast:
The difference in color or luminance between the marking and the road surface plays a crucial role in visibility. High-contrast markings are more visible, especially under varying lighting conditions.
Retroreflectivity:
Road markings are often designed to be retroreflective, meaning they bounce light from vehicle headlights back toward the drivers. This enhances visibility at night or in low-light conditions.
Maintenance:
Proper maintenance, such as regular repainting, is essential to ensure that road markings remain visible over time. Faded or worn markings can reduce visibility and safety.
Weather conditions:
Visibility can be significantly affected by adverse weather conditions such as rain, snow, or fog. High-quality road markings are designed to remain visible in various weather conditions.
Daily time:
During certain times of the day, like early morning or evening, the visibility of road markings may decrease due to the angle of sunlight.
To ensure accurate data on road marking visibility, it is necessary to capture and analyze multiple videos under various daily timeframes and weather conditions using the AI model. These weather conditions encompass a range from sunny, rainy, snowy, cloudy, partially cloudy, to overcast. Daily timeframes include early morning, morning, afternoon, evening, and night. The mobile app automatically assigns time and weather condition tags to each recorded video. These tags are subsequently employed to generate and interpret the visibility report.
5.5. How does our AI model calculate the health score and visibility of markings?
Our AI model analyzes every frame of a recorded video, and for each frame, it calculates the health score by taking into account the quantity of both defective and intact markings present in that frame. This calculation also considers the probability of detection associated with the AI model's analysis of those markings.
However, the question arises: how are these frame-based results displayed on our Web GIS map?
To elucidate how the AI model computes health scores and visibility across roads, it is essential to delve into the hierarchical structure of highways within our Web GIS platform. Each frame of a video is linked to a specific GPS coordinate. Therefore, based on the frame rate of recorded videos by the InspectiMark app (25, 30, 48, 50, and 60), we will have 25, 30, 48, 50, or 60 GPS points on the Web GIS map, each point containing information extracted from its associated frame. These individual points, situated within each 40-meter section, collectively contribute to the creation of section-specific information. All the sections within a segment, each spanning 40 meters, consolidate their data to generate segment-specific information. Ultimately, all segments within a given highway culminate in the generation of comprehensive highway-level results.
The health score and visibility of highways, segments, and sections are determined based on the individual points' health score and visibility.
For a specific point on the map, its health score is derived as the maximum score from various measurements. For example, if point A has scores of 10, 7.5, and 8.1 in three different measurements, its final health score is considered as 10. Conversely, the visibility score for a specific point is determined as the minimum score among those measurements. In the case of point A, its visibility score would be 7.5.
When it comes to sections, their health score and visibility are computed as the average value of the health and visibility scores of points within that section. Similarly, for segments, the health score and visibility are calculated as the mean values of the health and visibility scores of points within that segment. For highways, the health score and visibility are determined by averaging the health and visibility scores of points located within that highway.
5.6. How is user privacy addressed by InspectiMark?
In our Web GIS platform, user privacy is of utmost importance. To safeguard individuals' personal information, we have implemented a privacy-conscious approach that includes blurring both vehicle license plates and human faces in our geospatial data. This intentional blurring not only complies with privacy regulations and ethical standards but also ensures that sensitive information remains protected. Furthermore, as a standard practice, our App records all videos without audio to ensure the privacy of our users.